|
|
vol 4 num 1

from VizMAP – letting you see where you stand…
Volume 4 Number 1
|
| About VizMAP
VizMAP Pty Ltd, is a leading supplier of terrain Visualisation and related services to the defence, GIS, environmental, mapping, mining and exploration industries, engineering and construction firms, developers and planners, as well as government administration departments dealing with land, transportation and the environment.
VizMAP’s products are designed to be run on reasonably to highly configured graphics computers (PC, Linux and Unix) for public display, group training, mission rehearsal, environmental monitoring, etc. and to enhance management decision making.
VizMAP is headquartered on Queensland’s Sunshine Coast (Australia) with affiliation in Asia, Europe, Africa and the USA and thereby provides support and services to customers worldwide.
If you need to visualise anything geographic, e-mail VizMAP here with the details.
For more information about VizMAP visit the VizMAP Web site at http://www.vizmap.com.au.
|
VirtualGeography
Subscription
Details
To subscribe to VirtualGeography,
click here.
To unsubscribe from VirtualGeography,
click here.
|
A Moment’s Notice
"They think they can make fuel from horse manure… Now, I don’t know if your car will be able to get 30 miles to the gallon, but it’s sure gonna put a stop to siphoning."
— Billie Holliday i |
|
VirtualGeography – the newsletter
|
| G’Day… and Welcome to VirtualGeography |
from here |
| Welcome to another free VirtualGeography from VizMAP Pty Ltd.
The original concept of one VirtualGeography a month works fine when there’s not a lot of work on. Fortunately for VizMAP, but unfortunately for the VirtualGeography, we only managed two issues last year. Maybe we can up the count this year. A first in early February bodes well.
Unfortunately, the Calendar has to go. This takes by far the biggest percentage of time in collating a VirtualGeographyand is partially the reason why distribution isn’t more frequent. I have left the links to the online calendars to allow you to chase events for yourself. If you know of other online calendars of events, or particulat conferences or seminars that should be included, please let me know…
VirtualGeography is a collection of interesting snippets from all over the shop, dealing with industry issues concerning the computer based visualisation of geography and a few other associated (or otherwise) interesting bits and pieces. You are receiving this either because you subscribed to VirtualGeography or you have had recent dealings with VizMAP Pty Ltd. If you do not wish to receive further instalments of VirtualGeography, just click on the unsubscribe link at the bottom of this e-mail.
It is planned that a new VirtualGeography is pushed out every now and then when I’ve collated enough interesting bits and pieces, which shouldn’t be too big a drain on your mailbox if you’re not already subscribed (of course it won’t be a drain on your mailbox if you ARE subscribed, either  ). The regularity of the distribution may vary depending on what else is going on at VizMAP at the time. If you know of anyone who might like to get VirtualGeography, feel free to forward this to them and ask them to subscribe. By the way, subscription and unsubscription details are at the bottom (click here). ). The regularity of the distribution may vary depending on what else is going on at VizMAP at the time. If you know of anyone who might like to get VirtualGeography, feel free to forward this to them and ask them to subscribe. By the way, subscription and unsubscription details are at the bottom (click here).
So, g’day to all you enthusiasts requiring to visualise and simulate both urban and rural geographic information (GIS), cartography, photogrammetry, remote sensing, digital elevation modelling (DEM) and general mapping.
By the spelling of "Visualisation" you may have already guessed that we’re not US based – that’s a good thing, or at least not a bad thing. This comes to you from Mooloolaba on the Sunshine Coast of Queensland, Australia, where it’s beautiful one day and perfect the next.
|
The link between visualisation and mapping may seem a little esoteric if this is your first encounter with this sort of stuff, but let me tell you, the bond is significant… but enough of that: on with the show… I hope you like it. Any feedback you might have is highly appreciated. E-mail me here to make your comments.
Enjoy…
Graeme Brooke
VizMAP Pty Ltd
|
 |
P.S. You’ll need an active internet connection to view any images that are in the content. We’ve done it this way to keep the size of the e-mail to a minimum.
|
| |
Back to Top |
| The Industry’s Two Cents Worth… |
| Space View Reveals Scale of Disaster |
from The USGS |
| Within hours of the Asian Tsunami, the USGS National Center for Earth Resources Observation and Sciences (EROS) began providing pre-and post-tsunami satellite images and other vital information to help planners for disaster response from many agencies and organizations make well-informed decisions. In answer to the urgent needs of governments and service organizations, these images have been placed in an easily accessible website http://gisdata.usgs.gov/website/tsunami. The images vividly illustrate the human, social, and environmental toll of the tsunami. |
| Read that full story here |
Back to Top |
| Hardcore Stuff (hardware bits)… |
| Gulf Coast Science Center Opens a Spectacular Immersive Theater Powered by SGI Technology That Allows Visitors to Experience Jerusalem – As It Stood In 1 AD |
from SGI |
| Dead Sea Scrolls Exhibit and Virtual Tour of the Temple Mount Garners 50,000 Advance Ticket Sales
MOUNTAIN VIEW, Calif. (January 20, 2005)—The largest touring exhibition of the Dead Sea Scrolls and related artifacts ever seen in the United States arrives today at the Gulf Coast Exploreum science center in Mobile, Ala. Part of the Exploreum’s Gala Opening tonight is the unveiling of the Exploreum’s brand new Virtual Journeys Immersive Theater, powered by a visualization system from Silicon Graphics (NYSE: SGI).
Virtual Journeys will allow visitors at this and future exhibits to experience and interact with scientific discoveries using the same SGI® technology that leading researchers around the world depend on for groundbreaking innovations in all areas of science. To further enhance the public’s experience of the Dead Sea Scrolls exhibit, the Virtual Journeys Immersive Theater features a guided interactive tour of the reconstructed Herodian Temple Mount in Jerusalem as it existed 2000 years ago. Starting tomorrow, January 21, the general public can visit the 50-seat theater, which will hold four screenings an hour and will highlight the archaeology, history and religious significance of the temple.
Using the SGI® Reality Center® facility, an Exploreum facilitator will encourage questions and interaction from the audience. The facilitator acts as tour guide and, with just a click of the mouse in the Reality Center facility, can take the audience, based on their areas of interest, just about anywhere they may want to go within the Temple Mount real-time visual simulation model. The data set even includes differing opinions on the archaeological finds, which can be pointed out both visually and verbally during the presentation.
"I truly believe museums with interactive SGI Reality Center environments are going to become the museums of the future. In medicine, in biochemistry, in so many different areas, what you can teach in this room is phenomenal—totally limitless," said W. Michael Sullivan, Exploreum Director. "I’m very bullish on the future and on the idea that we’ll be doing things in this theatre 10 years from now that we haven’t even thought of yet. In education, in science, in art, the Reality Center facility has terrific possibilities. There isn’t an archaeological monument in the world that couldn’t use this technology."
At the Exploreum, visiting students and the general public first enter the Dead Sea Scrolls exhibit gallery featuring 12 large scrolls and artifacts from the Qumran site where the scrolls may have originated. The exhibit includes a fragment of a scroll containing passages from the Deuteronomy chapter of the Hebrew and Christian Bible—the only scroll in existence with the entire text of the Ten Commandments. In the Exploreum’s upstairs Minds-On Hall, visitors can view and participate in various interactive experiments including DNA testing and radio-carbon dating of the preserved animal skin scrolls. They can then proceed to the approximately 2,000 sq. foot Virtual Journeys Immersive Theater for the 8 to 9 minute interactive presentation.
"Interactivity, or ‘science in action,’ is considered the future of science education by many in the field," noted Sullivan. "The combination of education and entertainment makes science immediately interesting in a way textbooks cannot. And now, with Virtual Journeys, we have added the visualization element, which is how real science is conducted today. We have the SGI Onyx system behind a glass wall so visitors can actually see the computer that provides this incredible learning experience."
|
| Read that full story here |
Back to Top |
| Softcore Stuff (software & data bits)… |
| NASA Designs 3D Digital Map of Earth |
from VOANews |
| Geographers, video game designers, and anyone else who needs a detailed three-dimensional map of Earth’s mountains, valleys, and other land areas now have one available. Technicians at the U.S. space agency NASA and the Defense Department have finished converting high altitude space shuttle radar images of our planet into full-color digital topographical maps that far exceed the detail and accuracy of previous images.
The space shuttle mission bounced radar signals off Earth’s surface for 10 days in 2000, but it has taken technicians four years working with supercomputers to make commercially useful three-dimensional maps of them. The last land areas to be completed are Australia, New Zealand, and islands in the Pacific Ocean.
NASA scientist Michael Kobrick says two radars aboard the space shuttle collected 12 terabytes of raw elevation data. That is enough digital information to fill 15 million compact disks. "So we had to put those together to make a coherent three-dimensional map. It’s not just like making a photograph like we do a lot from space, from satellites. It’s much more painstaking. You have to be much more careful to get it exactly right because people’s lives in some cases depend on it," he says.
The space shuttle orbited Earth in a criss-cross pattern, covering 80 percent of the landmass. Each time it circled, both radars emitted 1,500 signals over a 250-kilometer-wide swath. The time it took for the pulses to bounce back was a measure of the distance between the instruments and the Earth’s surface. The two radars were spaced 60 meters apart to provide a three-dimensional view.
Mr. Kobrick says the data will benefit scientists, engineers, government agencies, and the general public with a wide array of uses.
"Siting [locating] communications towers is a lot easier to do if you have a digital elevation map. It can be used in airplanes. There is no technical reason now why a pilot can’t have in the cockpit a virtual display, almost like a video game display, of what it [the ground] should look like out the window just in case he can’t see out the window because of darkness and bad weather," he says.
In fact, Mr. Kobrick says a video game developer uses the data so his computer flight simulator program can display actual terrain. "It’s surprising how much application there is. People are coming up with uses for these kind of data that I frankly never even thought of before," he says.
The images show details of Earth’s topography down to about 100 meters in size, the length of a football field. Mr. Kobrick says in time NASA would like to improve the resolution so the maps could show details as small as an automobile. The goal is to have a satellite return full-time radar data to show changes in Earth’s elevations over time.
|
| Read that full story here |
Back to Top |
| Proposed Barossa Valley Powerline |
from VizMAP |
| Electranet SA operates and manages the electricity transmission network throughout the State of South Australia.
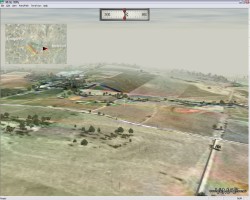
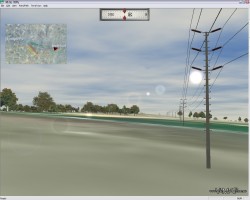
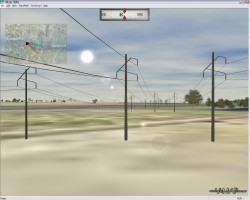
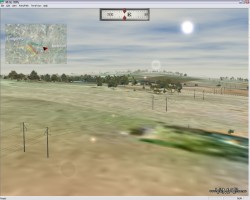
Electranet SA engaged VizMAP Pty Ltd to create a geospatial Visualisation of the proposed Templers to Dorrien 132kV transmission line for the purpose of public consultation and internal Electranet SA discussions and planning.
During the route selection and environmental impact assessment phases of a transmission line project, one of the issues foremost in the minds of those responsible for selecting possible alignments is the visual impact of the proposed infrastructure. The method most widely used in the past for visualising a transmission line has been to pre-determine vantage points along a proposed alignment, and superimpose tower outlines and conductor catenaries on photos taken from these vantage points.
In an attempt to meet community expectations of being able to get a clearer idea of what the structures and conductor catenaries of a new transmission line might look like, a digital model is required that will deliver continuous visualisation of the proposed alignment.
Such a model also assists in locating the best alignment for the proposed line from a visual aspect by being able to continually view the alignment from any point in the general area of the line. The model also assists in the production of environmental impact reports.
Click on these small resampled images to view the full screen images on the VizMAP website. Bear in mind that these are just screen dumps from a dynamic, interactive, 3D "flythrough".
If you would like more information on this project, let VizMAP know.
|
| If you have a need to dynamically visualise your geographic data, let VizMAP know your requirements… |
Back to Top |
| Reality is virtually here |
from The Sydney Morning Herald |
| Playing out scenarios using models in virtual worlds might sound like fun but it is becoming more than a game. Serious three-dimensional online learning is starting to take off, particularly in aviation and heavy industry. David Fallon, Catalyst Interactive’s defence account manager, says virtual reality for training is becoming affordable, with the simulations provided for the army’s new Tiger helicopters costing about half what they would have three years ago.
"3-D modelling is also useful for teaching safety precautions," Fallon says. "One of the classic examples is on a mine site where there is a drag line of earth and ore. If you take these pieces of equipment offline for training purposes, it can be quite expensive. It reduces the time the trainee needs access to the equipment."
Catalyst Interactive makes what are known as "part-task" simulators, which don’t have all the physical characteristics of full simulators. Fallon also characterises Microsoft’s Flight Simulator game as a part-task simulator, because "you don’t have the feeling of the aircraft turning or banking".
"Where we are going with it is being very specific and being able to customise it to specific needs," Fallon says. "No matter what people say, every 737 in the world is not alike. We have a change configuration system so there’s a flow-down effect for when the procedures or hardware changes."
|
| Read that full story here |
Back to Top |
| Whazzup Next – with 20/20 Foresight… |
| Check these sites for events to look out for in the Vis/Sim, GIS, LIS, Remote Sensing & Photogrammetry calendars… |
|
| |
Back to Top |
A Parting Gesture… |
| New Helmsman |
From Grime |
| A young man who wants to see the world signs on to a tramp steamer to be trained as a helmsman.
He masters the classroom instruction, then starts his practical training on the wheel of the vessel. In his first lesson, the mate gives him a heading, and the young fellow holds to it.
Then the mate orders, "Come starboard."
Pleased at knowing immediately which way starboard is, the young man leaves the helm and walks over to his instructor.
The mate has an incredulous look on his face as the helm swings freely. Then, rather gently considering the circumstance, he asks politely, "Could you bring the ship with you?"
|
 |
Back to Top |
|
Feel free to forward this to whomsoever you wish.
To e-mail the VirtualGeography Editor, click here.
To subscribe to VirtualGeography, click here.
To unsubscribe from VirtualGeography, click here. |
| |
…that’s all, folks! (for now).
|
|
VizMAP
- Bureau & Services Portfolio
- Contact Us
- News
- Gladstone Port Access Road nearly complete after VizMAP visualisation convinces Council
- TerraTools Exporter for Virtual Battlespace 2 (VBS2) Now Available – 23/3/9
- Updated interactive “Flash Map” of Advanced Mining Projects in Queensland by VizMAP to be distributed to delegates of Mining 2006
- VizMAP & E2E deliver workshop at Queensland Spatial Conference, Brisbane, Queensland – 17/7/8
- VizMAP creates “virtual trek” to the Everest Base Camp
- VizMAP creates virtual coal mine for central Kalimantan
- VizMAP develops interactive “Flash Map” of Advanced Mining Projects in Queensland
- VizMAP imagery of Virtual Surat Energy Province awarded image of the month by Image Society Inc.
- VizMAP Launched
- VizMAP launches FlyLG: computer based geospatial Visualisation tailored to Australian local government areas
- VizMAP presents at Australia Pacific Spatial Innovation Conference 08, Canberra, ACT – 19/11/8
- VizMAP presents at GITA 07, Brisbane, Queensland – 8/8/7
- VizMAP presents at GITA Seminar, Darwin, Northern Territory – October, 2006
- VizMAP presents at Queensland Spatial Conference 2008, Brisbane, Queensland – 18/7/8
- VizMAP presents at Surveying and Spatial Sciences Institute (SSSI) Meeting, Hervey Bay
- VizMAP Presents TerraTours® Visualization at World Energy Congress
- VizMAP presents to Darling Downs Interest Group in GIS and Remote Sensing (DIGGARS) Seminar, USQ, Toowoomba, Queensland – 8/11/7
- VizMAP presents to International Map Trade Association (IMTA), Surfer’s Paradise, Queensland – 2/11/7
- VizMAP presents to Queensland Spatial Industry Council (QSIC), Brisbane, Queensland – 22/11/7
- VizMAP writes for Position Magazine – “The 3D Industry” – April-May 2007, No 28
- VizMAP’s Virtual Surat Energy Province
- VirtualGeography Index
- VizMAP
|


